I obsess over my startup’s metrics.
I constantly have Google Analytics realtime running in my browser to monitor traffic on Referly, and throughout the day I check it to see how many people are concurrently visiting our website (scroll to bottom to watch video on how to use this tool). I can see how many are new and how many are returning, where they came from and which parts of the site their are viewing, all within a glance. The psychology of this quick data dump into my brain is powerful, either reassuring me that people are discovering us or scaring me into thinking we might live in obscurity forever.
This is one of the worst images a startup founder can imagine (an empty bank account balance is at least an order of magnitude scarier) – and I saw it this morning:
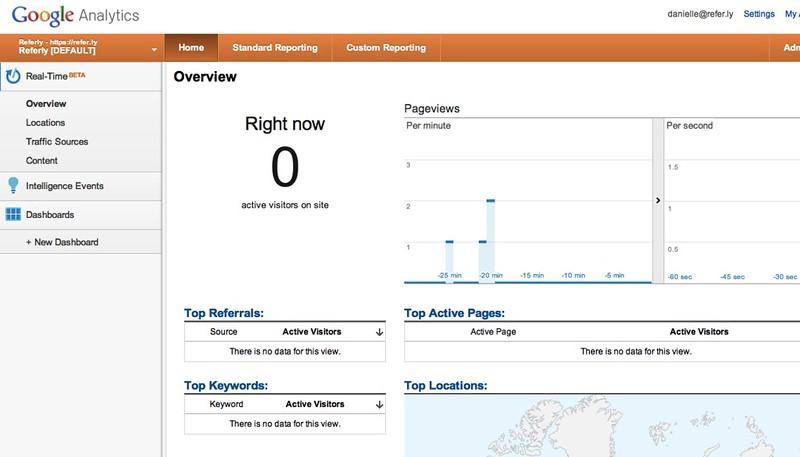
The saving grace here is that it is before 8am Pacific Time as of writing this, so traffic is just beginning to climb. However, that does also indicate that Referly is primarily being adopted by West Coast people in the early-adopter tech community. We are working hard to branch out and reach people all over the U.S. who want to make a little extra income referring products they love. Looking at you New York!
For Google Analytics Realtime, in my head I set a “low water mark” where if the concurrent visitors on the site drops below it I treat it as a red flag (and usually go tweet, blog, etc. to drive more traffic). Â For the past few weeks the low water mark has been 0, and this week I raised it to 1. Â To put this in perspective, just 2 months ago when I was using this practice at my previous company this number was in the hundreds. Â We have a long way to go.
Find Metrics You Can Obsess Over
One great piece of advice from PG, which reminds me of the early days at Twilio, is to find a single metric you can obsess over. For us, it is not web traffic because of the nature of Referly’s business, but for a lot of consumer startups being able to drive traffic successfully is a great place to focus in the early days as you are getting people to kick the tires on the product for the first time and building a word-of-mouth revolution where people are coming back and bringing their friends.
Here’s what our traffic has looked like over the pay 2 months (we launched May 14th):

The Psychology of Looking at Web Traffic
Web traffic can be a dangerous metric to obsess about, because it is fickle. The graph above is smoothed at the monthly level, and on the daily and even weekly levels you can see major peaks (launch announcements, other press) and valleys (nothing interesting has happened for 5 days ahhhH!)
It can also become a vanity metric, because it is something you can buy. Â This is a big reason why I advise companies not to take any paid traffic unless they have very clear mechanics for converting that traffic into actually revenue in a short period of time. Â For businesses with very high lifetime customer value, or high anticipated revenue in the first 90 days of a user registration, you can justify paying for traffic. Â But for social sites, meme generators, news sites, fashion sites, and any other site where the user and her data ARE the product — don’t buy it. Â If you can’t make it organically you don’t have a product yet.
The reason this is so dangerous is that once you buy traffic you will have this graph that you can make go up and to the right on command. Â Simply pump more money in, and the visits numbers will go up — probably as conversion rates go down (if they don’t then keep going!). Â As your team and investors begin to see this graph it sticks in their mind. Â People love to cling to the only scrap of apparent success in an otherwise muddled heap of we-don’t-really-know-yet. Â Beware vanity metrics, Google Adwords can be very difficult to put down once you’ve started.
Graphs That Shape Your Life
I remember attending an art appreciation session years ago lead by Lee Sandstead (OMG I just Googled him and he is Emmy Nominated now! congrats Lee!!!) where he talked about the power art has over our everyday lives. Â Simply by having it on our walls, by looking at it in passing, it shapes our world view.
 The most amazing observation was that it doesn’t even have to be art one likes. Â Take for example the most common piece of artwork found in the Western world, Ave Maria – which is the baby Jesus sitting on the lap of the Virgin Mary. Â Definitely not a piece of art I’m into putting up all over my house (I’m an atheist).
But Lee made this amazing point — it would be better to have this artwork on your walls than nothing. Â If he lived in a world where this was the only artwork allowed (as was the case for hundreds of years) he would welcome it.
It would shape you — you would look at it from time to time and reflect on it. Â It might be simply religious symbolism to you at first, but over time it also might take on other meanings and conjure up other thoughts and memories. Â It would become a point of conversation, maybe with other people, but certainly with yourself. Â It would become a dialogue you returned to over and over again – anything from the mother to son relationship, to asking why he gazes at her but she does not appear to return her gaze to his eyes. Â You might have questions about the halos they wear on their heads, or maybe what she is reading, or why his torso seems so misshapen.
Metrics are the startup version of Ave Maria.
Stick them on the wall, talk about them with each other, reflect on them privately, turn the data this way and that way in your mind trying to understand what it means. Â Forge new connections. Â Place two graphs next to each other which you assume are unrelated and test that assumption.
Metrics You Should Consider Obsessing Over
Here are some other metrics you might consider measuring and understanding. Some of them are more important than others to different kinds of businesses – and what you really want to look for is a single metric that can really tell you whether you are succeeding or failing.
- Visits & %Â Unique Visitors (you could have very high visits because you have the same people coming back over and over again — not a bad thing! Â but important to differentiate from the number of truly unique people)
- Change in your bounce rate over time (are people who come to your site sticking around? Â is it what they expected to see when they clicked through from wherever they were before?)
- Number of times your website is mentioned each day on Twitter
- Number of sites advertising against your website on Google, Facebook, etc.
- % of users who come back more X times
- % of users who come back and perform an action more than X times
- % of users who contribute to revenue
- % of users who have made a “round trip” in your product (completed the GOAL of the product)
- Average number of days (or hours) it takes for a user to go from signed up to achieving the “round trip”
- Signup conversion rate (by day of week, by region, by time on site)
- Email open and click through rates (transactional emails vs. newsletter emails)
Some of these things can’t be tracked with Google Analytics alone, I definitely suggest checking out Pardot and Kissmetrics for more sophisticated event tracking.
There are probably many more, and I’ll keep adding to this list. Â Do you have a startup metric you obsess over? Share it in the comments and help your fellow entrepreneurs.
How to Use Google Analytics Realtime
Great video from Darren Rowe to help you get started
Great post!
Here at Bundlr, we have an iPad near our desks, most of the times just displaying our Google Analytics real-time dashboard. Although the number of concurrent visitors is addictive, it’s more useful to figure out traffic sources and usage patterns.
Danielle, you should replace GA real-time with @GoSquared:disqus  (Passion Capital portfolio), much better and more accurate representation of current active users, their engagement etc.
Great post and love the new distributionhacks blog. Keep it coming!